

The list view
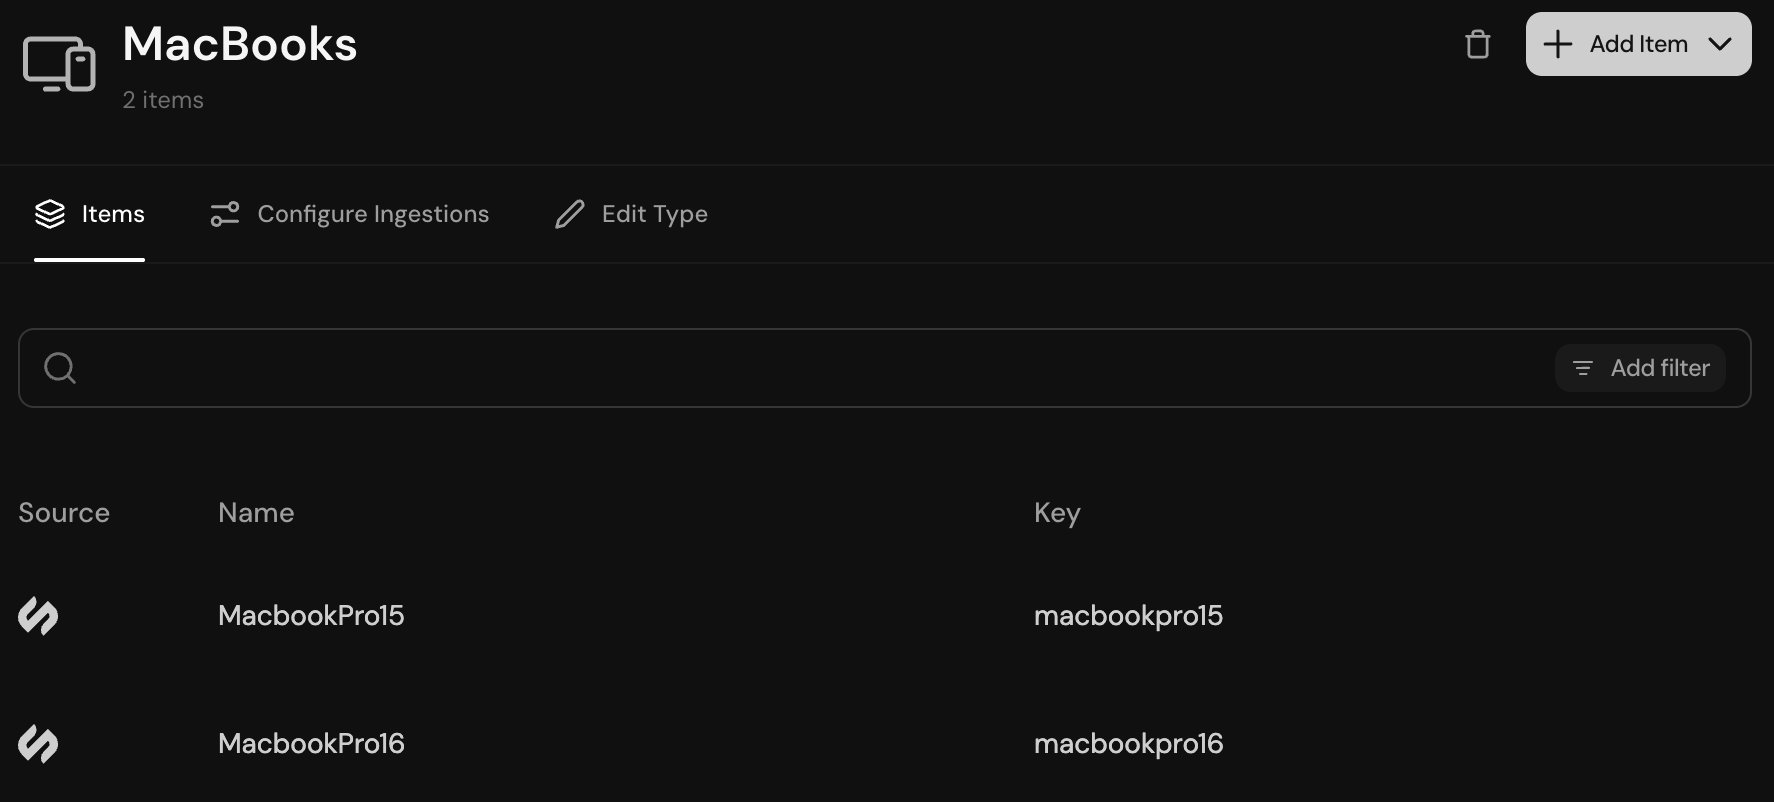
The list view for an item type
- Click Columns to pick which fields show
- Filter on any column
- Click on a column to sort ascending or descending
- Search in the search box
- Move between pages (500 items per page by default)
- Save and share views
- Set a default view
Related items
Open an item’s Related tab to browse its connections:- Reference fields: items and users referenced by this item’s fields, and items whose reference fields point to this item.
- Relationships: connections stored in relationship types, in either direction.
The context graph
Click any item on its detail view to see its context graph.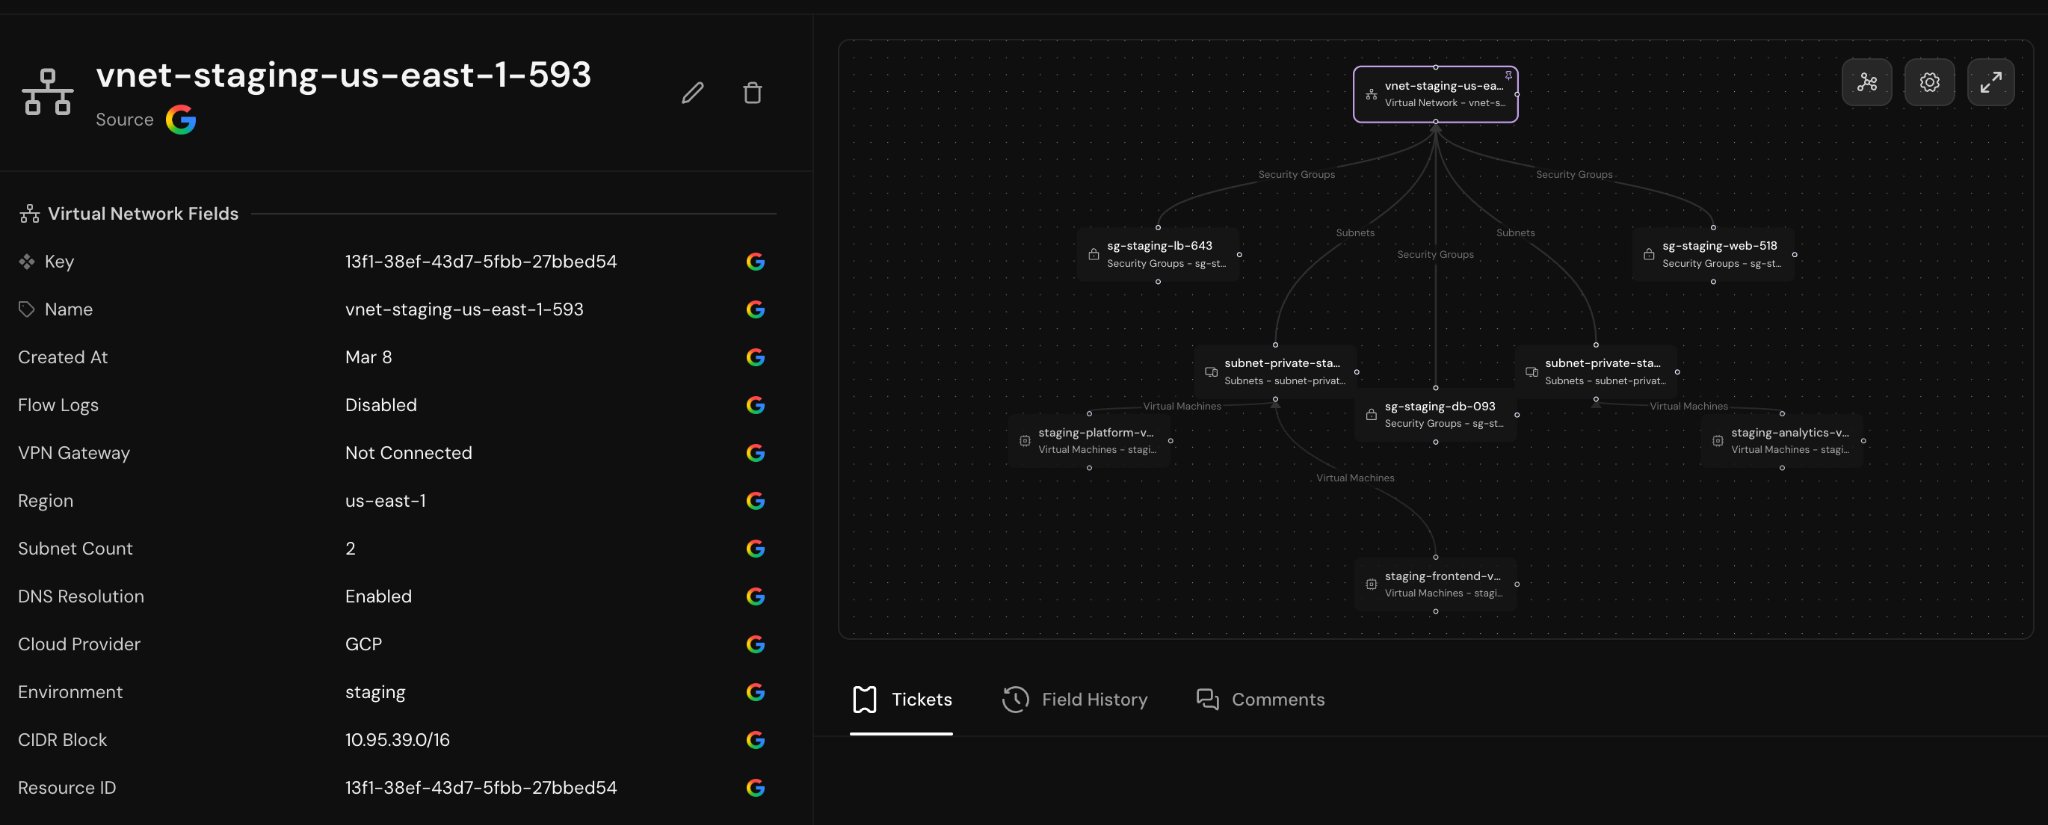
The context graph for an item
A person’s items
A user’s profile has an Items tab that works like a database dashboard scoped to that person. The Tables pane on the left lists every table whose items reference the user through a user reference field, grouped by database, with the field name and the number of items under each table.- Graph: the first row opens the user’s context graph across every table. A table with more than a handful of references collapses into a footer such as 54 Accounts; click it to browse those items. The legend starts with items only, and you can switch on groups, teams, tickets, and other neighbors.
- A table: pick a table to see its items in the familiar table view, pinned to the user with a read-only filter chip such as Account Manager is Aashna Panchal. Add filters, search, and show archived items as usual. Open in [database] takes you to the table in its database with the same filter applied.